Abnormal's behavioral AI ingests thousands of internal and external signals to establish behavioral baselines across identities and relationships, then surfaces anomalies indicating social engineering attempts. The platform's API-native architecture deploys in minutes with no tuning and no disruption to mail flow, enabling immediate value realization. Abnormal integrates with existing security infrastructure rather than replacing it, complementing rule-based and signature-based systems with behavioral detection capabilities.
Abnormal's detection engine operates across three integrated layers:
Identity Awareness analyzing sender authenticity, account behavior patterns, and authentication signals
Context Awareness evaluating communication history, relationship dynamics, and typical business process flows
Risk Awareness assessing unusual request urgency, atypical financial authorization patterns, and communication timing deviations
While rule-based and signature-based systems often struggle with novel attack patterns, behavioral AI detects novel, language-based attacks that evade traditional detection—including sophisticated generative AI attacks.
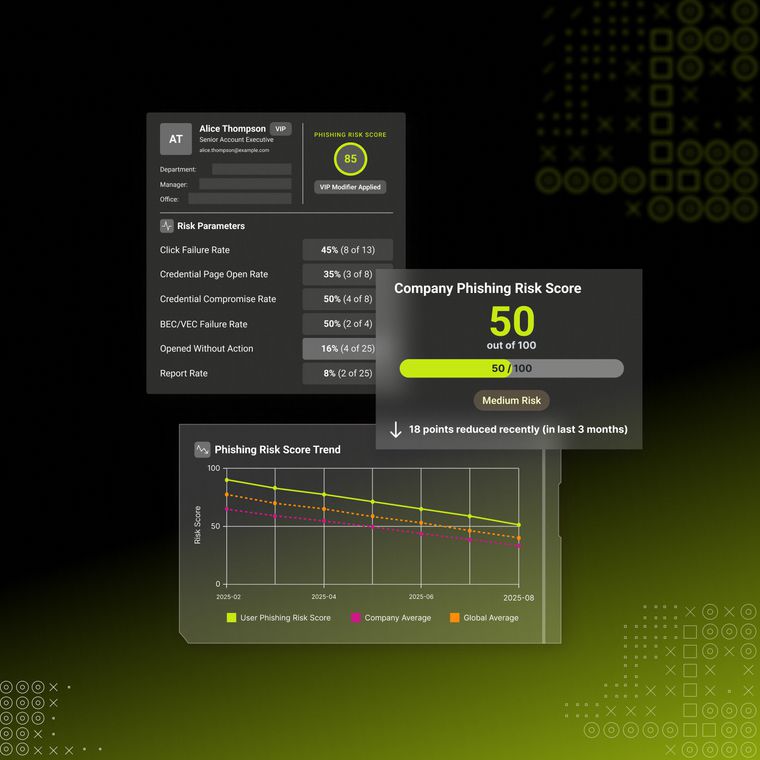
This approach generates quantifiable metrics for board reporting, including anomaly detection scoring measuring deviation from established behavioral baselines, probability-based risk quantification for users and departments, and communication pattern analysis identifying unusual relationship interactions. These capabilities enable security teams to quantify social engineering exposure in terms leadership can evaluate alongside traditional infrastructure threats.