Key Insights
Track the right cybersecurity KPIs to measure email protection effectiveness and prove return on investment (ROI) to leadership.
Cybersecurity KPIs translate sensor logs and alert counts into business language executives understand: how quickly your team spots a phishing link, how fast you remove it, and how much financial loss you may avoid by reducing the likelihood of data exposure. The stakes keep climbing. According to the FBI's Internet Crime Complaint Center (IC3), reported losses to internet crime reached $20.9 billion in 2025, and email remains a common delivery mechanism for malware and social engineering schemes.
Strong email security KPIs drive smarter investment decisions, justify budget requests, and demonstrate compliance without drowning the board in technical detail. Five core indicators quantify email threat management and connect daily security work to measurable business outcomes.
Key Takeaways
- Segmenting Mean Time to Detect (MTTD) and Mean Time to Respond (MTTR) by threat type and business unit pinpoints detection gaps and verifies that automation delivers measurable risk reduction.
- High false positive rates bury real threats, accelerate analyst burnout, and strain security operations center (SOC) teams by flooding them with low-value alerts.
- Threat detection rate only tells the full story when it's paired with visibility into the false negatives that slip through undetected.
- A rolling month-over-month avoided cost chart highlights changes in social engineering activity and shows executives how stable defenses remain over time.
Why Cybersecurity KPIs Transform Email Risk Into Business Value
Email security KPIs help security leaders connect technical performance to risk reduction, operational efficiency, and executive reporting.
By measuring specific protection aspects, these indicators help organizations identify vulnerabilities and improve security posture while sharpening stakeholder communication about tangible risks and investment benefits.
Leaders can use the same KPI set to:
- Compare Control Performance: Benchmark detection and response by threat family, team workflow, and business unit.
- Document Trend Lines: Track performance over time to support audit evidence.
- Guide Automation Decisions: Identify where automation or tuning will reduce the most risk.
Effective dashboards pair these actions with speed, accuracy, coverage, and avoided loss so executives see whether email defenses improve over time. Behavioral analytics can help improve email KPI performance and accuracy by grounding threat detection in how an organization actually communicates, so metrics reflect its real risk profile rather than generic benchmarks.
Mean Time to Detect (MTTD)
MTTD shows how quickly your email security program identifies malicious messages after they reach an inbox. Trimming this interval can reduce an attacker's chance to pivot deeper into your environment. Organizations that rely on periodic log reviews rather than continuous monitoring can leave threats undiscovered longer, increasing remediation costs and regulatory risk.
Extended MTTD increases attacker dwell time (the length of time an attacker remains undetected inside an environment), giving adversaries more opportunities to exfiltrate data or launch secondary attacks through compromised accounts. Security teams can compress detection time by adopting behavioral analytics for email-borne threats, so deviations like a sudden wire request from a new domain can trigger an alert.
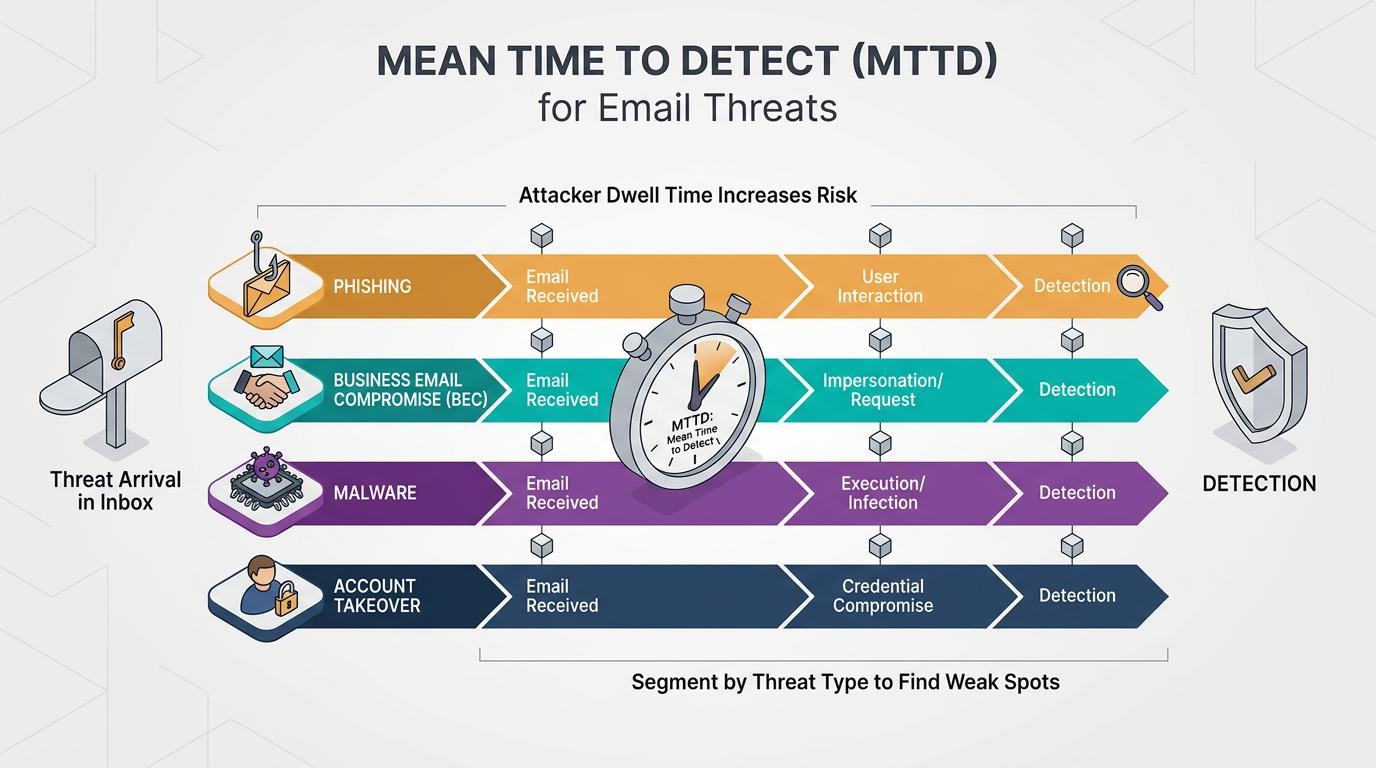
Segmenting MTTD by threat type pinpoints weak spots and guides targeted improvements across:
- Phishing: Deceptive messages designed to trigger a malicious click or credential entry.
- Business Email Compromise (BEC): Impersonation attacks that exploit trust in executives, vendors, or coworkers.
- Malware: Attachments or links that deliver a malicious payload once opened.
- Account Takeover: Compromised credentials used to access mailboxes or connected cloud systems.
Tracking each category separately shows where detection consistently lags, rather than hiding a weak spot inside a single blended average.
Mean Time to Respond (MTTR)
MTTR shows how efficiently your organization moves an email threat from detection to complete remediation. Faster response times can limit attack windows and business disruption. Manual workflows trap analysts in time-consuming tasks:
- Triaging Alerts: Reviewing and prioritizing incoming security alerts by severity.
- Hunting Down Malicious Message Copies: Searching every mailbox for other instances of the same threat.
- Revoking Credentials: Resetting compromised passwords and access tokens.
- Notifying Users: Alerting affected employees and stakeholders.
Each of these steps adds time between detection and containment, which is exactly what automation is designed to compress.
Security teams can improve this KPI with security orchestration, automation, and response (SOAR)-based playbooks that help remove malicious emails, reset compromised accounts, and open tickets for review. Auto-quarantine for messages violating behavioral baselines can help analysts start from a contained state rather than managing live incidents. Integrating email telemetry through security information and event management (SIEM) integration and collaboration tools provides unified context that reduces console switching and speeds response decisions. Tracking MTTR by threat category and business unit helps verify that automation investments deliver measurable, organization-wide risk reduction.
Threat Detection Rate and Coverage
Threat detection rate helps leaders understand how well email controls identify malicious activity before it creates user or business impact. The calculation divides detected threats by total threats, though this formula only delivers meaningful insights when you track the unseen false negatives that slip through. Behavioral analytics can help maintain detection accuracy while keeping false positives minimal by baselining workflow cadences, vendor interaction patterns, recipient behavior, and content signals. The bar keeps rising: the FBI IC3 reports that attackers now use AI chat generators to create official-sounding emails mimicking a company's CEO or other officials, stripping away the errors employees were trained to spot.
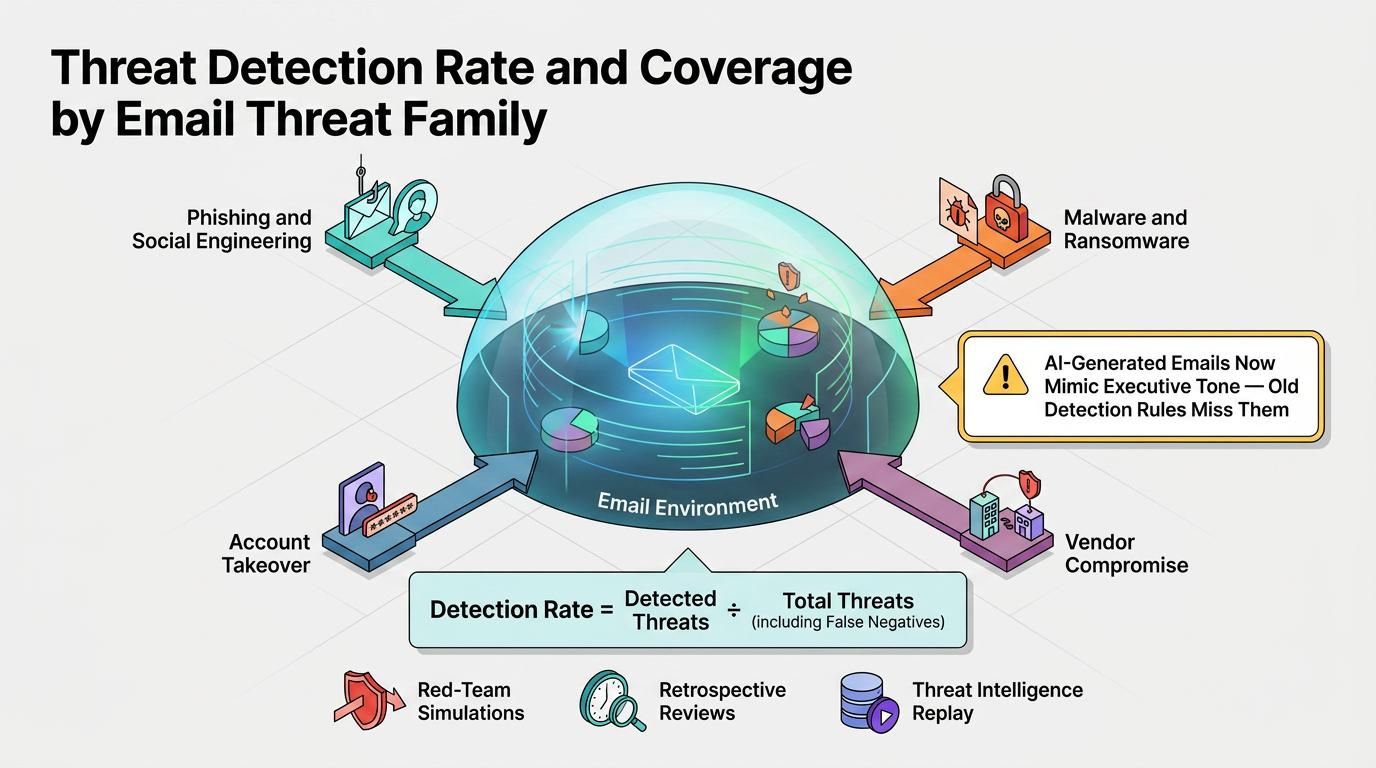
Security teams can break detection numbers down by threat family to strengthen executive reporting:
- Phishing and social engineering attempts show how often attackers rely on user deception.
- Malware and ransomware payloads reveal how often email carries technical compromise risk.
- Account takeover indicators help quantify identity-driven exposure.
- Vendor compromise and other supply chain risks show third-party exposure through email workflows.
Validation can include red-team email simulations, retrospective reviews of user-reported incidents, and threat intelligence replay tests that send recent campaigns through your filters.
False Positive Rate and Alert Accuracy
False Positive Rate (FPR) shows how much legitimate email traffic your security controls misclassify, directly impacting analyst efficiency, organizational trust, and how much review burden that creates. Elevated FPR creates immediate operational strain: an ISACA report, State of Cybersecurity 2025, found that 66% of cybersecurity professionals say their role is more stressful now than five years ago, and 47% cite high stress as the top reason people leave the field. Excessive noise buries real threats.
High FPR can also frustrate employees whose legitimate messages get quarantined, increase help desk tickets, and create more review work for security teams. Would your analysts still trust the alert queue if a third of it turned out to be noise? An analyst feedback loop can help ensure mislabeled emails feed model refinement. AI-based prioritization can suppress low-risk events and escalate credible indicators of compromise. Behavioral analytics tools profile senders, recipients, and message content in email workflows, which helps avoid the static rule structures that generate alert floods and shortens analyst review cycles.
Blocked Attack Volume and Avoided Cost
Blocked attack volume connects email security activity to potential financial and reputational risk reduction.
Security teams can start by logging the threats their controls intercept and segmenting them so executives grasp the mix of risk they face:
- Phishing Attempts: Credential theft or malicious-link campaigns targeting employees.
- Malware and Ransomware Payloads: Attachments or links designed to compromise systems.
- BEC and Impersonation: Executive or vendor impersonation aimed at fraudulent transfers.
- Credential Harvesting Campaigns: Attacks designed to steal login information.
- Vendor Fraud: Fraudulent requests posing as trusted suppliers or partners.
Consider a mid-market manufacturer that blocks a vendor-impersonation email requesting a change to banking details before it reaches accounts payable. Logging that single block as a five- or six-figure avoided loss, rather than a routine quarantine, is what turns blocked-attack volume into a boardroom-ready number. Teams can translate totals into dollars by multiplying blocked attacks by the average loss per attack. The FBI IC3 report recorded BEC losses of $3,046,598,558, a defensible input for this model.
Presenting these figures as a rolling, month-over-month chart can reveal changes in social engineering themes while plateaus indicate stable defenses. Because the calculation roots in actual detections rather than projections, it supports budget conversations with detection-based evidence.
Turning KPIs Into a Stronger Email Security Program
Cybersecurity KPIs work best as a system, not a scoreboard. Detection speed, response speed, coverage, accuracy, and avoided cost each expose a different failure mode, and tracking them together shows where a defense genuinely holds up under pressure. Security teams that segment these metrics by threat type and business unit, rather than reporting one blended average, are better positioned to close specific gaps before they turn into incidents. Treating KPI tracking as an ongoing discipline, not a one-time audit, is what keeps a program credible as email threats keep evolving.
