Executive Summary
General-purpose LLMs aren't as effective as purpose-built behavioral AI cybersecurity solutions. This paper documents a controlled head-to-head comparison—the Abnormal detection system against seven frontier models—so you can see exactly how and why.
We tested Claude Opus 4.6/4.8, Sonnet 4.5, Haiku 4.5, GPT-4.1, GPT-5 Mini, and Gemini 3.5 Flash, each used as a single-pass email classifier on the same 1,000 confirmed attacks and 1,000 confirmed-safe messages. Every message was labeled by Abnormal's own threat analysts, whose expert review is the reference standard throughout. Each model was given the same task: read the message, return a verdict.
On cost and latency, the results are structural—these gaps are large, consistent, and insensitive to prompt or configuration:- 300–6,500× more expensive per million messages. Frontier models cost between $6,342 and $130,093 per million messages as classifiers, compared to ~$20 for Abnormal.
- 19–79× slower to return a verdict. Abnormal returns a median decision in approximately 0.4 seconds. Frontier models ranged from roughly 8 to 32 seconds on the same task—a delay that compounds at enterprise inbox volume.
- Of the attacks Abnormal caught, frontier models would have missed between 46% and 96%. The best single-pass model caught 54% of confirmed attacks; the weakest flagged fewer than 1 in 20.
- Most models correctly identified fewer than half of truly safe messages as safe. The best passed 59% of legitimate emails correctly; the worst, just 12%. Abnormal's false-positive rate on this set: ~1%.
What the numbers mean. Detection is a two-axis problem: catch attacks while leaving legitimate mail alone. These two objectives pull in opposite directions, and no single-pass model found a configuration that navigated both. Models tuned for high recall generated severe false-positive rates; models tuned for precision missed the majority of attacks. Abnormal's multi-stage behavioral AI is specifically engineered to navigate this trade-off using organizational context—behavioral baselines, sender relationship graphs, and campaign-level signals—that a message-level LLM call cannot replicate.
On validation. The cost and latency findings are the primary structural conclusions—large, robust, and independent of dataset composition. The detection results reflect a focused evaluation set rather than representative inbox traffic, which shifts constantly across environments and over time. We validate detection performance separately on representative traffic as a continuous effort; the cost and latency advantages stand on their own.
Bottom line. No frontier model used as a drop-in classifier comes close to what purpose-built behavioral AI delivers on detection accuracy, cost, or speed. For any organization evaluating whether general-purpose LLMs can replace or approximate a purpose-built email security system, this paper provides the empirical answer.
Methodology
We compared the Abnormal detection system—a multi-stage pipeline combining behavioral models, downstream rules, and an LLM critic—against seven frontier models each run as a single-pass classifier. Each model received one message and returned one verdict with no pipeline or surrounding context.
Working from real production mail, we built two test sets of 1,000 messages each, every one labeled by Abnormal's own threat analysts—whose expert review is the reference standard for every figure in this paper:
- Attack set—1,000 confirmed attacks. Real threats spanning business email compromise (BEC), vendor email compromise (VEC), executive impersonation, credential phishing, invoice fraud, and high-volume commodity attacks.
- Safe set—1,000 confirmed-safe messages. Legitimate mail including internal correspondence, vendor and partner communications, newsletters, and transactional notifications.
For each system we recorded five metrics: attacks flagged (recall), safe mail correctly passed (clean-pass rate), emails wrongly removed (of messages flagged as attacks, the share that were actually safe), cost per million messages, and decision latency. Latency is reported as the median (p50)—the midpoint of observed response times. Detection figures reflect this focused evaluation set and are validated separately on representative traffic; cost and latency are insensitive to dataset composition.
01 · The Question
General-purpose LLMs are extraordinary generalists, and a fair question for any specialized security vendor is whether a frontier model could simply replace a dedicated detection system. Email security is a useful place to test that, because it is a narrow, high-stakes decision made billions of times a day: a wrong call either lets an attack reach a person or buries an analyst in false alarms.This paper reports a controlled experiment built to probe one version of that question—could a single frontier-model call, dropped in as a classifier, do the job the Abnormal detection system does? We're careful to separate what the experiment settles from what it points to: the cost and speed results are conclusive, and the efficacy comparison reflects this specific evaluation set, not production performance.02 · Experimental Design
2.1 Systems compared
We compared two very different things: the Abnormal detection system and a single model call. Abnormal takes an email, runs it through a behavioral detection engine and a stack of AI models, and returns a decision—attack, spam, graymail, or safe. Each frontier model was given the same job in a single pass.
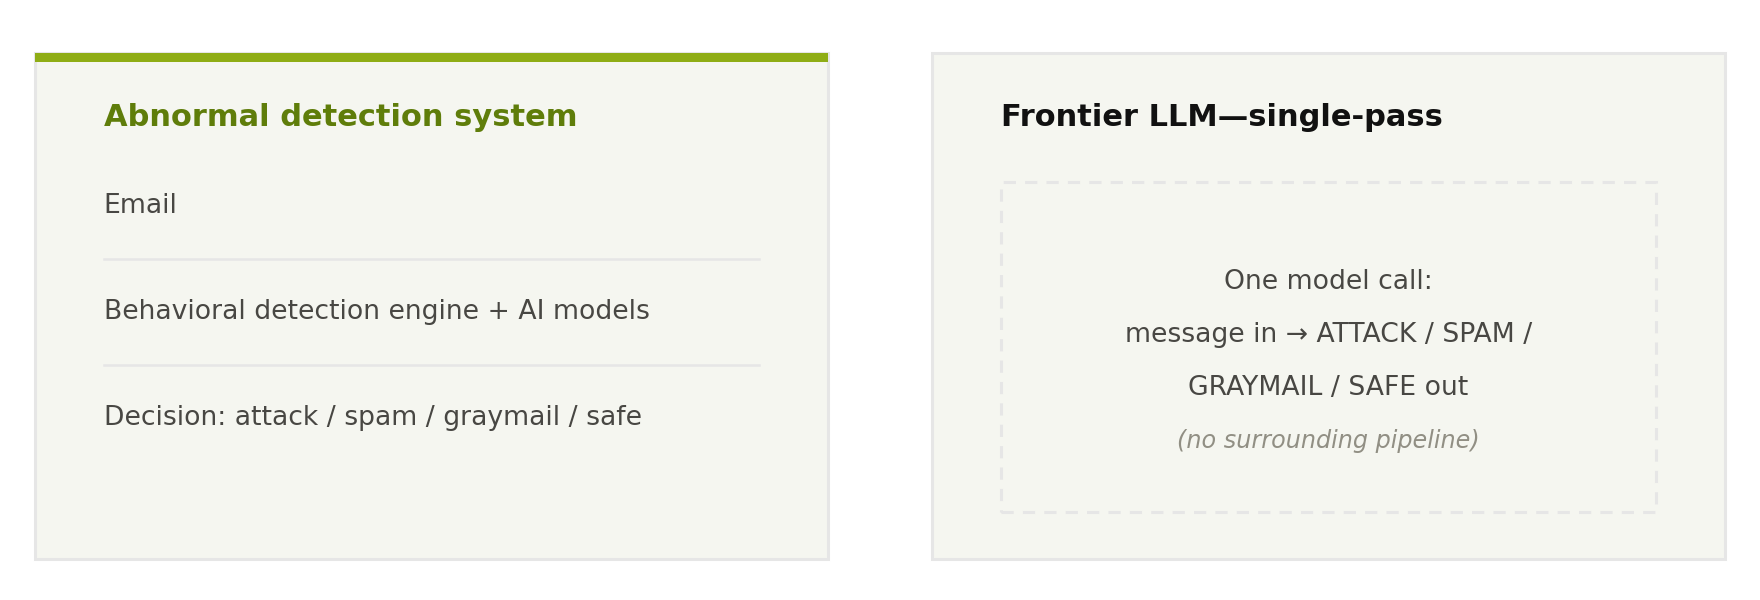 Figure 1. The Abnormal detection system is a multi-stage pipeline; each LLM is evaluated as a single classification call—the way a team would use one if it were standing in for a detection layer.
2.2 The test sets
We built two test sets of 1,000 real production messages each—one of attacks, one of safe mail. Each message's label is confirmed by Abnormal's own threat analysts—expert human reviewers who triage real-world attacks across our customer base every day, and whose judgment is the reference standard for every figure in this paper. So a "confirmed attack" is a message a human expert reviewed and labeled as an attack; a "confirmed-safe" message is one they reviewed and cleared. The sets were deduplicated at the campaign level, and the attack set spans the threats security teams face every day, from sophisticated social engineering to high-volume commodity attacks.
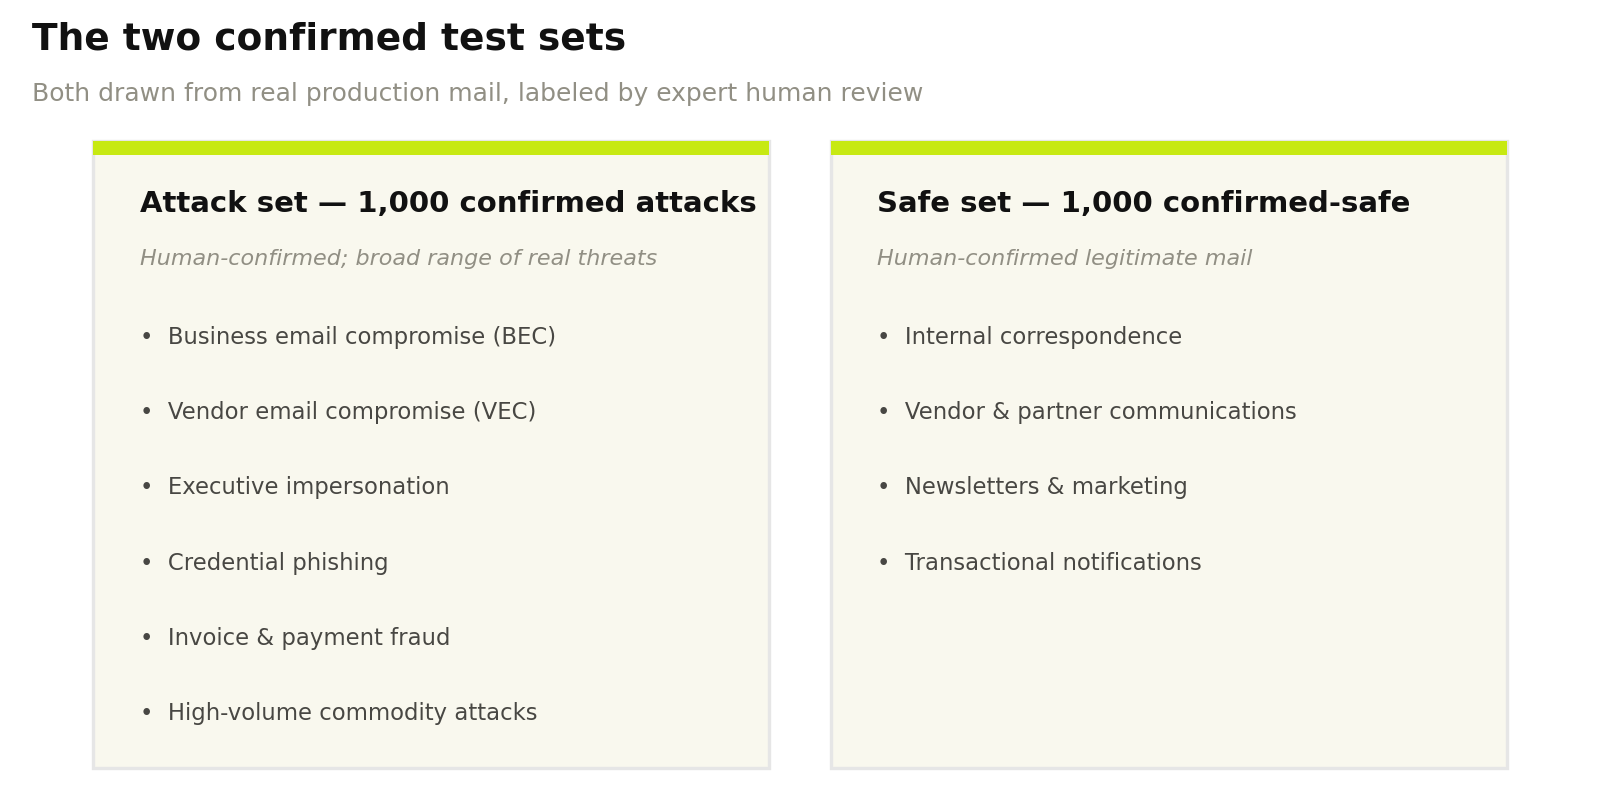 Figure 2. Both sets are drawn from real production mail, labeled by expert human review, and cover the full spread of message types a security team sees—sophisticated BEC and VEC through to simpler, high-volume attacks.
This is a focused evaluation set, not representative inbox traffic—and in production, traffic distribution shifts constantly, with every customer seeing a different mix that changes as attacks evolve. No single benchmark number generalizes across environments, so we treat the efficacy comparison as indicative and validate it separately; the cost and latency gaps don't depend on it. One important note: the Abnormal system's ~99% figures describe its performance on these specific sets. Because both sets are drawn from mail our production system already processes, these figures are consistent with—but not a substitute for—validation on a random sample of representative inbox traffic.
2.3 Why human labels
Using expert human review as the reference standard matters for one reason worth calling out: ground truth here is human, not a same-vendor LLM acting as judge. A recurring criticism of LLM-security benchmarks is their reliance on an LLM grader from the same family as the model under test—this design avoids that conflict, since both the system and every model are scored against the same independent human labels.2.4 How the models were run
Each model ran as a single-pass classifier—given a message, return one verdict (attack, spam, graymail, or safe), with no surrounding pipeline. Each was run under detection-oriented prompting suited to the scenario. Reasoning effort was set to medium where supported; GPT-4.1 ran without a reasoning-effort setting (unsupported).
2.5 Metrics
All scoring is against the human labels. We report two core outcomes and a derived metric rather than a single blended score:
- Attacks flagged (recall)—of the 1,000 confirmed attacks, the share each model labeled ATTACK.
- Safe mail kept (clean-pass)—of the 1,000 confirmed-safe messages, the share each model labeled SAFE.
- Emails wrongly removed (1 − precision)—of all messages a model flagged as ATTACK, the share that were actually safe. This measures how trustworthy a model's attack-flags are; the remainder of flagged messages were genuine attacks.
Latency is the median (p50)—the midpoint of observed response times, meaning half of runs came in at or below this figure. Cost is the per-message cost during the runs, scaled to one million messages. System cost is the amortized figure, since most mail is resolved by cheaper upstream stages before the behavioral model runs.
03 · Results
All eight systems on the same human-labeled set. Read the efficacy columns as results on a focused evaluation set, not production performance; cost and latency are the production-robust measures.| System | Attacks flagged | Attacks missed | Safe mail kept | Safe wrongly flagged | Cost / 1M | Latency vs. system |
|---|---|---|---|---|---|---|
| Abnormal | 99%† | 1%† | 99%† | ~1%† | ~$20 | 1× |
| Opus 4.8 | 53.9% | 46.1% | 40.0% | 53.8% | $130,093 | 34× |
| Opus 4.6 | 49.0% | 51.0% | 45.7% | 48.4% | $105,354 | 33× |
| Haiku 4.5 | 47.5% | 52.5% | 11.5% | 88.0% | $21,699 | 19× |
| Sonnet 4.5 | 44.4% | 55.6% | 17.6% | 80.4% | $79,929 | 79× |
| GPT-4.1 | 13.6% | 86.4% | 19.1% | 77.8% | $29,200 | 20× |
| GPT-5 Mini | 4.5% | 95.5% | 22.0% | 64.1% | $6,342 | 40× |
- Attacks flagged / missed—of the 1,000 confirmed attacks, the share caught vs. let through (missed = 1 − flagged).
- Safe mail kept—of the 1,000 confirmed-safe messages, the share kept in the inbox (TN / (TN + FP)).
- Emails wrongly removed—the inverse of precision (1 − precision): of the messages a model flagged as attacks, the share that were actually safe.
- Latency is p50 (median), shown relative to the system's ~0.4s; higher means slower. Cost is per million messages.
- † System efficacy reflects this focused evaluation set, not representative production performance.
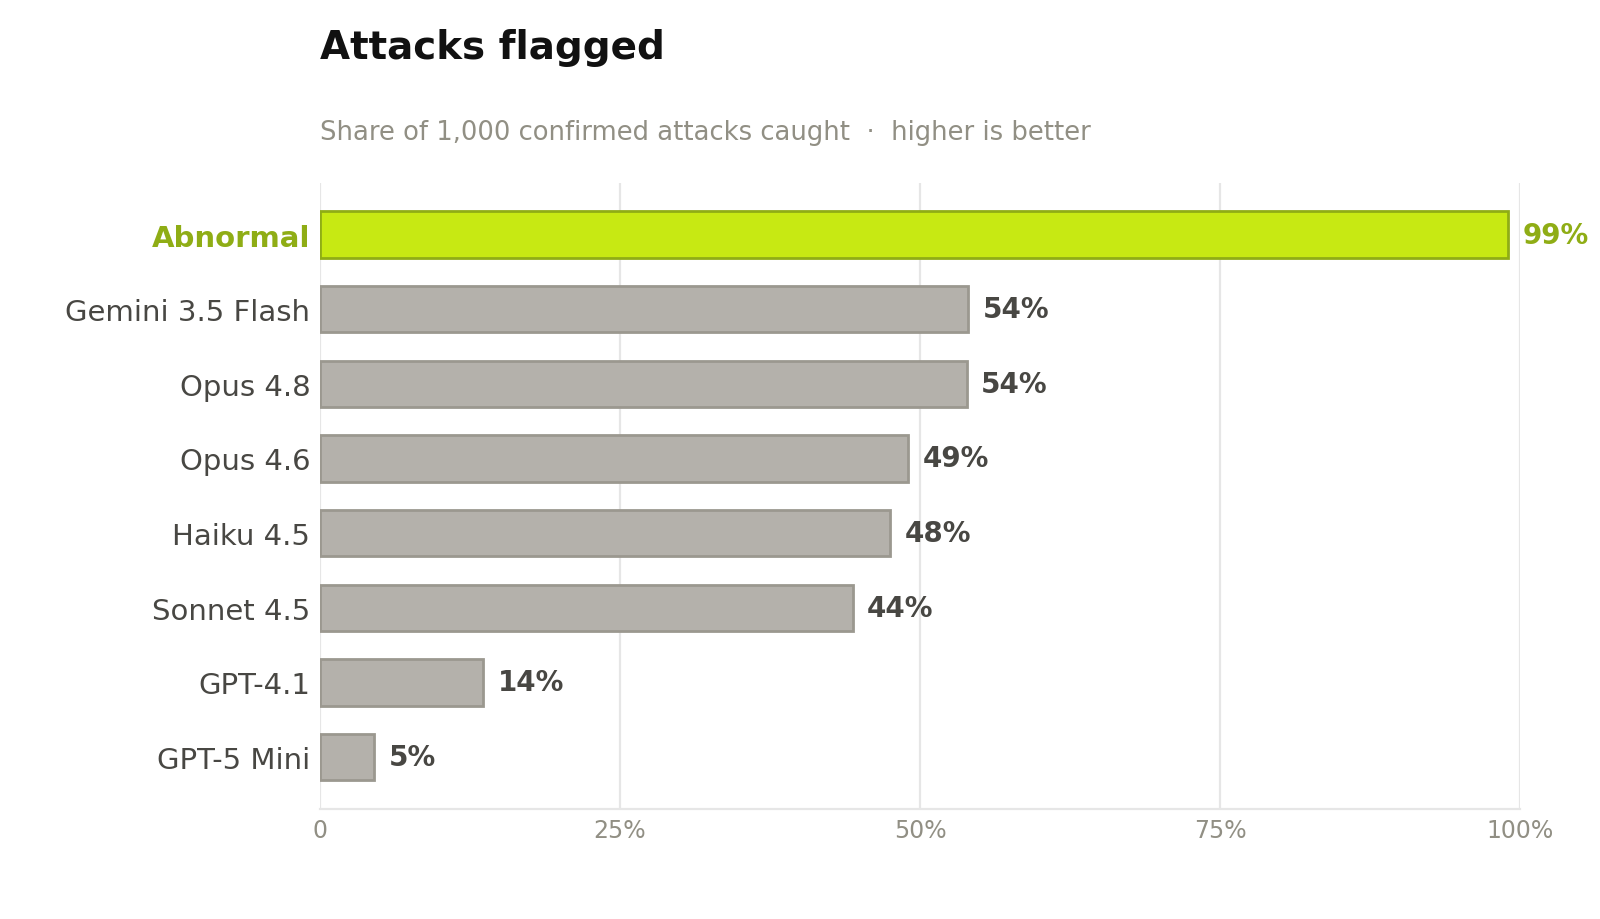 Figure 3. Attacks flagged on the confirmed-attack set (higher is better). Even the strongest single-pass model flags only about half; the smallest flag almost none
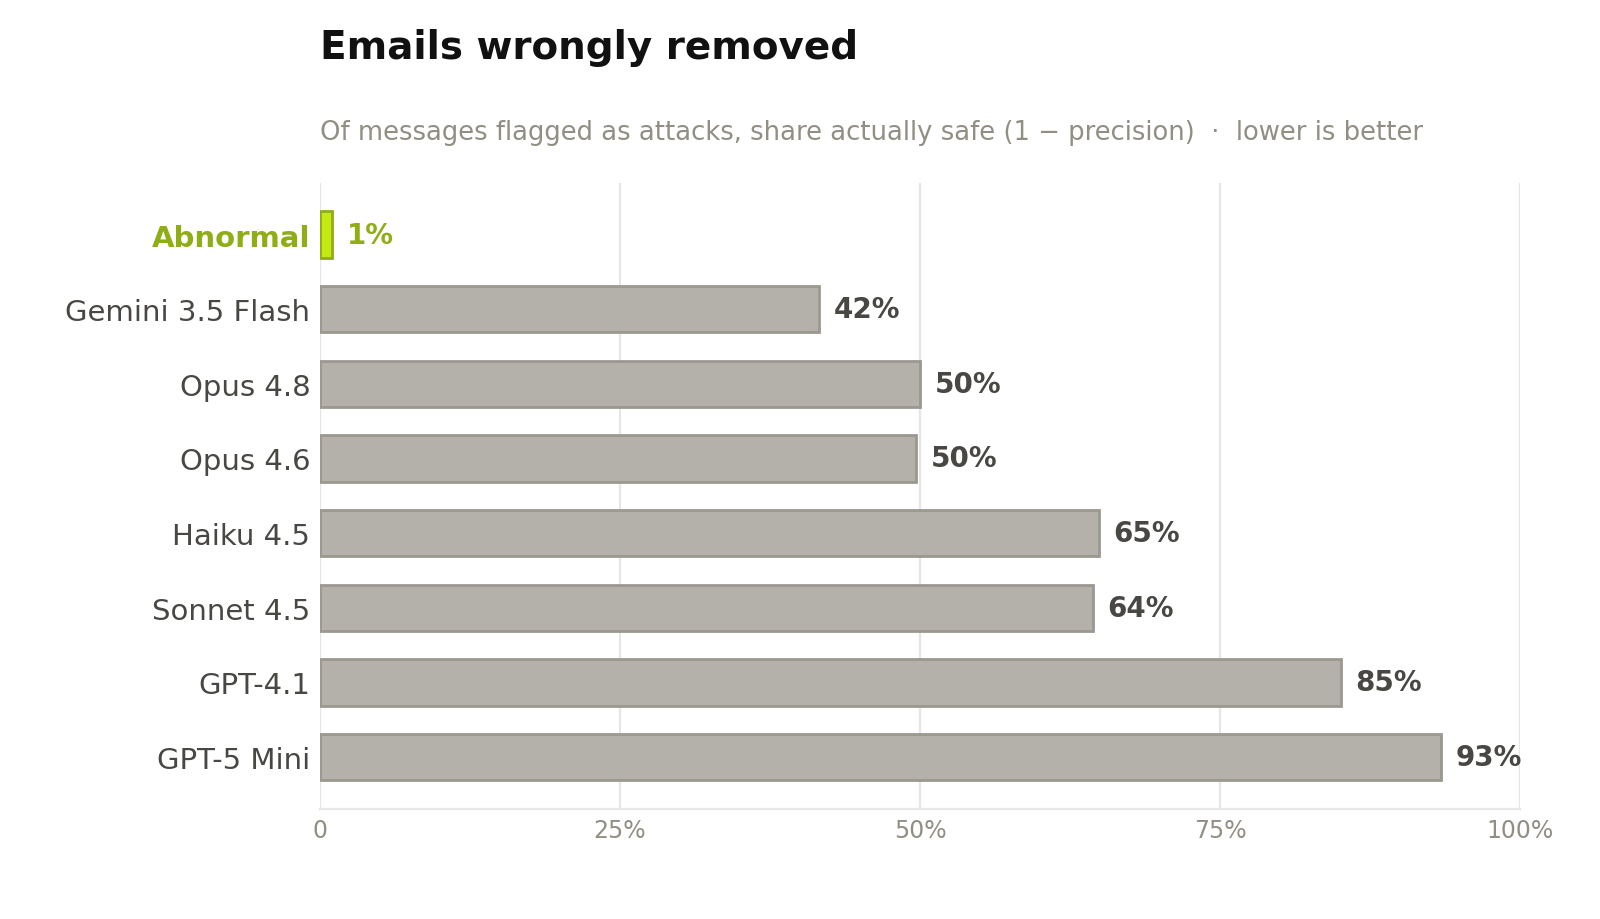 Figure 4. Emails wrongly removed—the inverse of precision (lower is better): of the messages a model flagged as attacks, the share that were actually safe. For every single-pass model, roughly half to nine-tenths of what it pulled from the inbox was legitimate mail.
3.1 One view of the trade-off
Detection is a multi-axis problem, so single scores mislead. The chart below plots every system by attacks caught (recall) against how trustworthy its attack-flags are (precision), with the win zone in the top-right. Each bubble is sized by cost per million messages—bigger means more expensive. The system is drawn as an outlined marker to signal its position reflects this evaluation set rather than representative traffic.
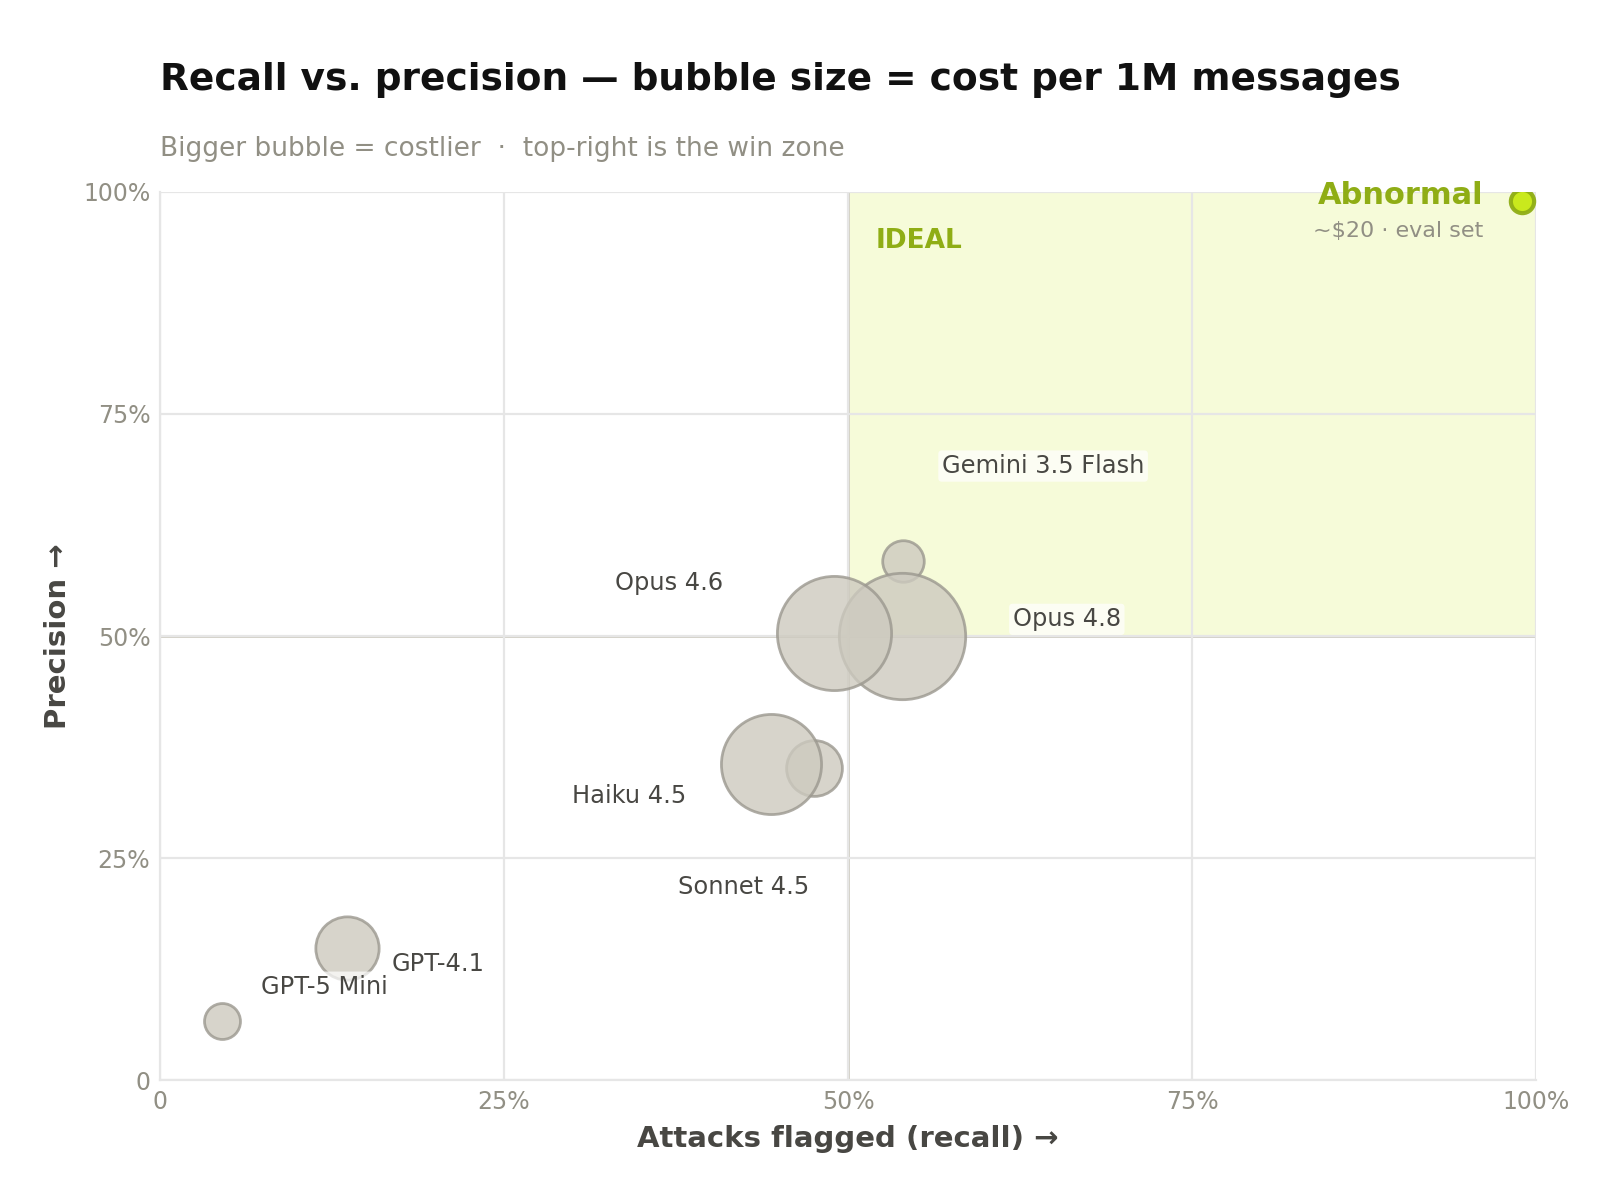 Figure 5. Recall (catch more →) against precision (more trustworthy alerts ↑); the shaded top-right is the win zone. Each bubble is sized by cost per million messages—bigger means more expensive. Abnormal sits in the far corner as the smallest, cheapest bubble; the frontier models cluster well short of it at far larger cost—the closest, Gemini 3.5 Flash, still trails on both axes at roughly 500× the cost. Abnormal is outlined to signal its position reflects this evaluation set rather than representative traffic.
04 · What the Numbers Mean
Read the efficacy results as indicative of the right trend. On this focused set, no single-pass model matched the system's balance of catching attacks while leaving legitimate mail alone—the strongest flagged about half the attacks, and every model over-flagged a large share of safe mail.
Recall and false positives move together, so neither means much alone—what matters is the balance of the two, and on this set no single-pass model achieved the system's. These efficacy figures describe this set; we validate them separately on representative traffic.
The defensible claim. As a drop-in single-pass classifier on this set, a frontier model does not match the Abnormal detection system's balance of catching attacks and leaving legitimate mail alone—at roughly 300–6,500× the cost and 19–79× the latency. The cost and latency gaps are robust to prompt and configuration; the efficacy comparison reflects this evaluation set, not production performance.
05 · How to Read These Results
A benchmark is only as useful as the clarity about what it measures. Three notes frame how to read the results above.5.1 · A focused evaluation set — Efficacy figures reflect this evaluation set. This is a focused evaluation set, not representative inbox traffic. In production, traffic distribution shifts constantly—every environment sees a different mix, and it changes as attacks evolve—so no single benchmark number generalizes. We treat the efficacy comparison as indicative and validate it separately on representative traffic.
5.2 · Configuration matters — LLM results depend on prompt and setup. Each model was run as a single-pass classifier under detection-oriented prompting. Results depend on prompt and configuration and would differ under other setups; the per-model figures reflect this configuration rather than a model's ceiling.
5.3 · Robust vs. set-specific — Cost and latency are the load-bearing findings. The cost and latency gaps are large and insensitive to prompt and dataset choices—they are the findings to lean on. The efficacy comparison reflects this evaluation set, and we validate it on representative production traffic as a separate, continuous effort.
5.4 · Variance & contamination — What we report, and what we guard against. Efficacy figures are computed over 1,000-message sets per class; we report results as a single evaluation and are adding multi-run confidence intervals so variance is visible rather than assumed. Because evaluation messages are real production mail rather than a published benchmark, the risk of overlap with model training data is low, and we treat contamination checks as part of the representative-traffic validation.
06 · Validating on Representative Traffic
Because production traffic differs by environment and shifts over time, the efficacy comparison is something we measure continuously rather than once. The validation that turns the set-specific read into a representative one has a few components:
- Representative sampling. A random sample over live traffic with human labels, so the mix of easy and hard cases mirrors a real inbox.
- Matched operating points. Compare systems at a common false-positive rate, the way rigorous detection benchmarks do, so none is advantaged by a convenient threshold.
- Per-model calibration. Sweep prompts and thresholds for each model to report its best achievable trade-off.
- Reported variance. Multiple runs with confidence intervals, plus a check that evaluation data doesn't overlap model training corpora.
- Reproducibility. Publishing the harness, or submitting to a third-party evaluator, to move the efficacy claim from internal signal to external evidence.
07 · Conclusion
On this focused evaluation set, no frontier model run as a single-pass classifier matched the Abnormal detection system's balance of catching attacks and leaving legitimate mail alone, or beat it on both axes at once. That result reflects this evaluation set—these figures, including the system's ~99%, describe this set rather than representative production traffic, which we validate separately.
The findings that do travel are the structural ones. A frontier model used as a drop-in classifier costs roughly 300–6,500× more to run and returns a verdict 19–79× slower than the system. Those gaps are large, consistent, and insensitive to configuration. For the "will general-purpose LLMs replace specialized detection?" question, the answer from this work is: not as a single-pass swap, on cost and latency grounds alone—and on detection, the system holds its balance against every model on this set, with representative-traffic validation underway.
Appendix · Glossary
- Single-pass classifier — A model given one message and asked for one verdict, with no surrounding pipeline.
- Indicative — A result that shows the right direction but isn't a production guarantee; validated separately on representative traffic.
- Recall (attacks flagged) — Of confirmed attacks, the share a system labels as an attack.
- Clean-pass rate — Of confirmed-safe mail, the share a model labeled SAFE.
- False-positive rate — Of confirmed-safe mail, the share a model flagged as an ATTACK; the remainder is sorted into spam/graymail.
- Operating point — A single (recall, precision) position a classifier occupies at a given threshold or prompt.
- p50 (median) — The midpoint value; half of runs were at or below it. Used here for latency.
Based on Abnormal internal benchmarking, March 1, 2026 – June 23, 2026. We compared Abnormal's purpose-built behavioral detection system with seven general-purpose large language models—Claude Opus 4.8, Claude Opus 4.6, Claude Sonnet 4.5, Claude Haiku 4.5, GPT-4.1, GPT-5 Mini, and Gemini 3.5 Flash—each run as a single-pass email classifier under detection-oriented prompting, evaluated against two balanced sets of 1,000 real production messages each — 1,000 confirmed attacks and 1,000 confirmed-safe samples, corpus design reviewed by the Abnormal Detection team, scored against expert human review by Abnormal threat analysts whose judgments are the reference standard throughout. Detection, cost, and speed were selected as the primary measures of security effectiveness and operational efficiency for enterprise email threat detection. Cost and latency figures are p50 (median) measurements from the runs and are not sensitive to dataset composition, prompt, or configuration. Detection figures reflect a focused evaluation set and are illustrative of this test rather than a guarantee of production results, which vary by environment and over time. LLM results depend on prompt and configuration; multiples are relative to the specific models and settings shown. Claude, GPT, and Gemini are trademarks of their respective owners; comparisons are for informational purposes.