NOTE: Demo visuals use either blurred real data or synthetic placeholders to protect customer privacy.
Blind Spots in Nora’s Performance
As Nora becomes the backbone of Abnormal’s AI ecosystem, reliability and visibility matter more than ever. Before now, teams only learned about slow responses or outages when someone posted in the GenAI Help channel. There was no unified way to measure Nora’s health, latency, or adoption across the company.
That’s why Tushar built the Nora Monitoring Dashboards: a dual observability system that tracks real-time performance and long-term usage, all built using Nora’s own development platform.
Before these dashboards existed, monitoring Nora’s behavior was a reactive, manual process.
- No automated health checks: Teams had to wait for users to report slow response times or failures.
- Limited visibility: There was no data on what caused delays, whether it was a rate-limiting error, a tool failure, or a Slack API bottleneck.
- No usage insights: Abnormal’s AI PMs had no way to see who was using Nora, which personas were most active, or how usage evolved over time.
Without data, troubleshooting and strategic planning were guesswork. Nora needed real monitoring to match its growing importance in daily workflows.
Dual Observability Dashboards
To bring visibility and scalability to Nora’s infrastructure, Tushar developed a two-part monitoring system. The first part is a real-time health monitoring system. Built on Grafana, this dashboard visualizes live system metrics, like the number of active requests, acknowledgment latency, and recent errors.
Example metrics include:
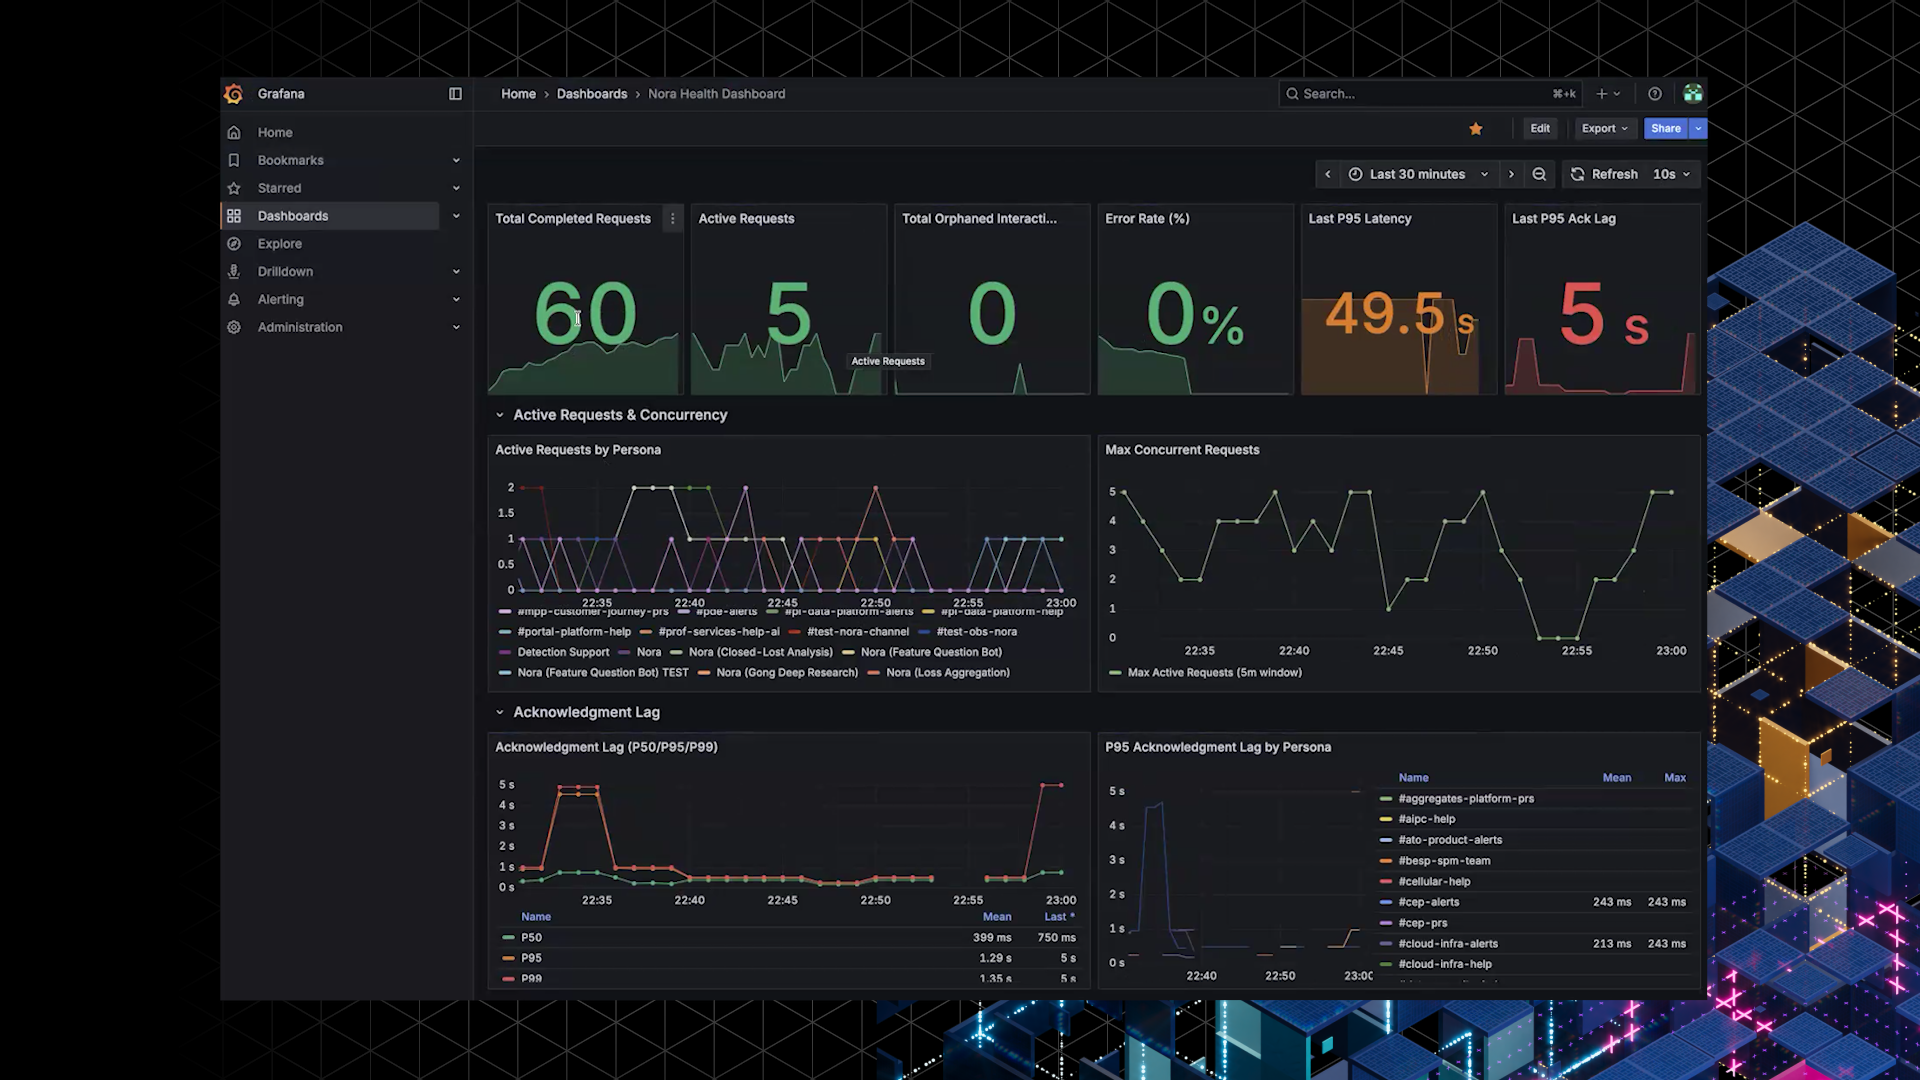
-
Requests handled in the last 30 minutes
-
Average response and acknowledgement times
-
Error rates and failure sources
During one live demo, Tushar pointed out a recent interaction and identified that a high latency spike was linked to a temporary Slack API delay.
The Grafana view gives AI PMs and engineers immediate awareness of performance dips, turning what used to be Slack complaints into measurable data.
The second dashboard, built on Databricks, tracks Nora’s behavior over time. It measures daily interaction volume, distinct active users (public channels only), success and failure rates, most-used Nora personas and tools, and latency trends over time.
The dashboard also surfaces top users and teams, offering insight into Nora adoption across Abnormal. Together, the dashboards turn Nora’s operations into a transparent, data-rich system, allowing engineering and AI PMs to monitor both system health and business impact.
Built by Nora, for Nora
What makes this project unique isn’t just the visibility it provides; it’s how it was built. The entire monitoring platform was created using Nora Plan and Nora PR, Abnormal’s internal AI-driven development framework. That means Nora effectively helped build the system that now monitors itself.
Tushar and the team used scalable data infrastructure powered by Amazon Firehose for log streaming, ensuring that all data flows into Databricks in near real time. And while the dashboards provide deep insight, they also preserve privacy:
- No private DMs or confidential data are captured.
- Retention policies ensure data is stored responsibly.
This balance between transparency and trust reflects Abnormal’s core approach to AI: innovative, privacy-conscious, and built for scalability.
From Guesswork to Insight
The Nora Monitoring Dashboards have quickly become an essential internal tool for the AI and platform teams.
- Real-time awareness: Engineers can instantly identify slowdowns, API issues, or LLM errors.
- Improved reliability: Issues that once took hours to detect are now visible in seconds.
- Data-driven decision-making: PMs can monitor adoption trends, track persona usage, and assess where new improvements will have the most impact.
- Self-service visibility: Any internal user can access the dashboards at Go/NoraDashboard or Go/NoraUsage, no manual digging required.
By replacing anecdotal troubleshooting with structured monitoring, Tushar’s system makes Nora more dependable for every employee who relies on it daily.
A Foundation for AI Observability
This project goes beyond monitoring to become a model for AI observability across Abnormal.
- Dogfooding success: This was one of the first projects built using Nora Plan and Nora PR, proving their value as production-ready AI tools.
- Scalable architecture: Built with Firehose and Databricks, it’s designed to handle future growth as Nora adoption continues to expand.
- Cross-functional benefit: From AI PMs to engineering leads, everyone can now measure performance and reliability through a shared source of truth.
It’s a reminder that innovation at Abnormal isn’t just about what AI can create, but also about how AI helps us operate better, faster, and smarter.